2023 Week 10 | Repeater Widget
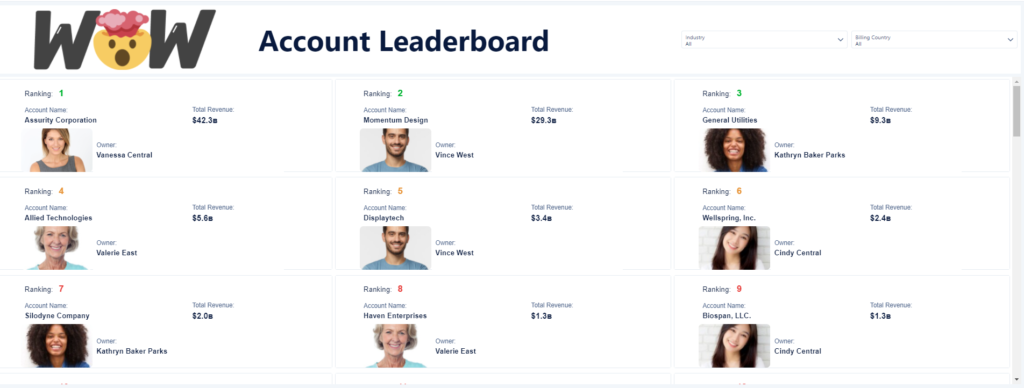
Introduction This week we are exploring transforming tabular data with repeater widgets to display our top accounts and sales people based on total revenue. Use repeater widgets to show select fields from a query in a scrollable list in your dashboard. Create a customized layout of text, numbers, charts, and images in a repeater widget, …