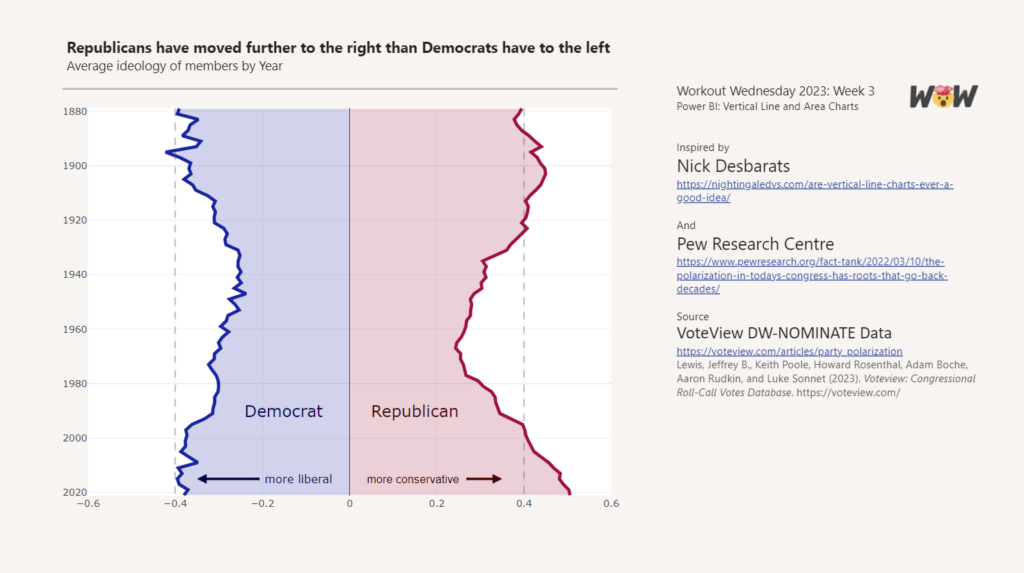
2023 Week 03 | Power BI: Vertical Area Chart
Introduction Howdy All! We’re all topsy-turvey this week turning line charts on their side! ⇩ This weeks challenge was inspired by Nick Desbarats article Are Vertical Line Charts Ever a Good Idea? Can you find some other examples where vertical line charts may be a good idea? ⋟^◕ܫ◕^⋞ Happy Vizzing Requirements Power Query Obtain the voteview_polarization_data.csv …