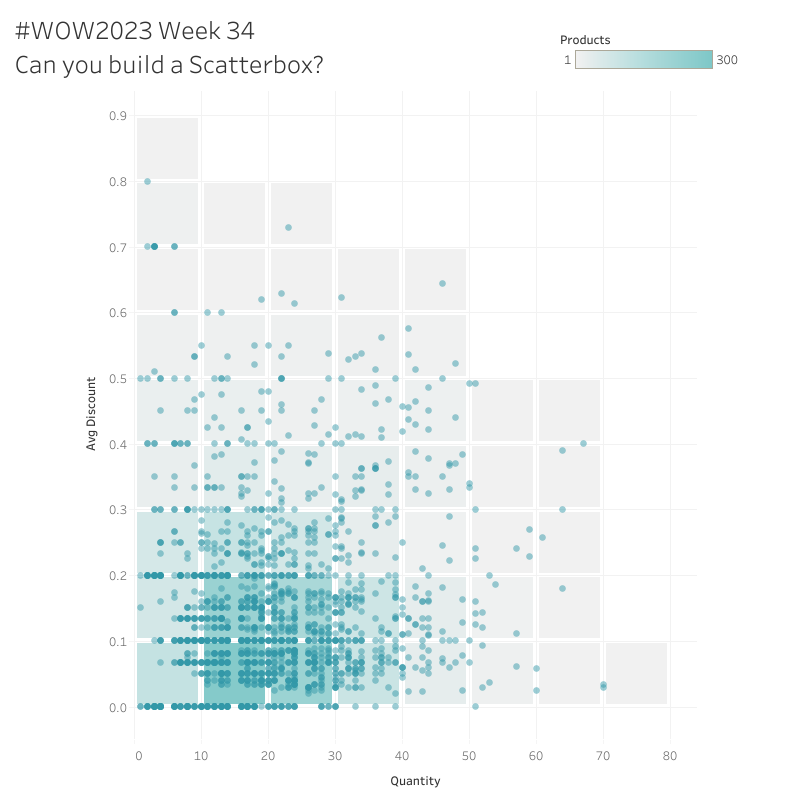
#WOW2023 Week 34: Can you build a scatterbox?
Introduction I’m so excited to invite Felicia Styer to the blog for this week’s challenge! Felicia is the Associate Director of Analytic Solutions at Playfair Data and hales from Kansas City, MO. Connect with her on Twitter and LinkedIn and here is her challenge! Long time fan, first time contributor! This week’s challenge is question …