Tableau

#WOW2023 Week 25: Can you calculate a percent difference between a range of dates?

Introduction I saw this visualisation floating around my twitter and trending on Tableau Public and thought it would make a great challenge for Workout Wednesday. Big thanks to Jacob for letting me use his visualisation as inspiration today! In this weeks workout, I want you to look at the percent change between two dates, we …

#WOW2023 Week 25: Can you calculate a percent difference between a range of dates? Read More

#WOW2023 Week 24 | Can you build a mobile KPI app?

Introduction This week’s challenge is another exploration of dynamic zone visibility, this time combined with a mobile app-like concept. Sometimes executives need just a few critical metrics at their fingertips, and this is a concept I’ve mulled around for a while (probably stemming from this concept by Anya A’Hearn) but felt like dynamic zone visibility …

#WOW2023 Week 24 | Can you build a mobile KPI app? Read More

#WOW2023 | Week 21 | Profit vs Target (with Tolerance)

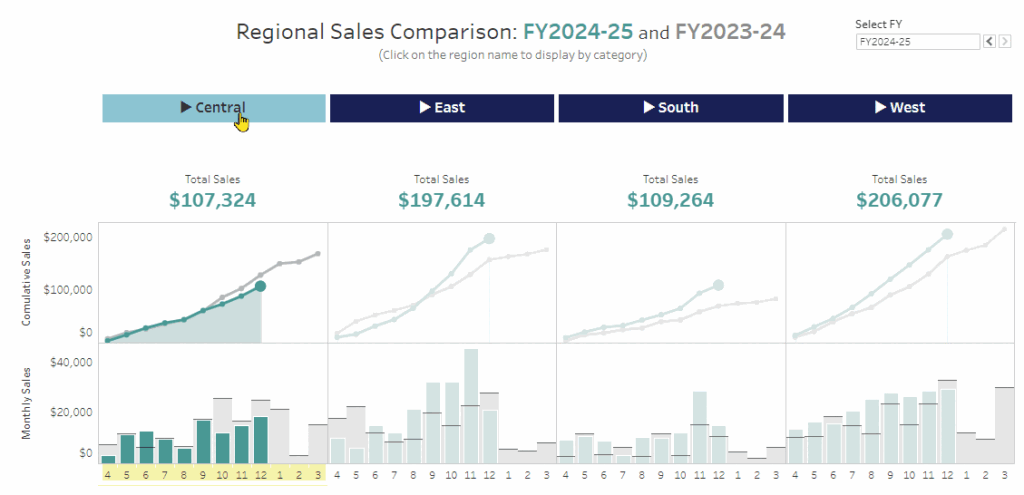
Introduction This week’s challenge is a slight twist on the classic Measure (bar) vs Target (gantt) chart. The key difference here is that we want to allow the user to select a ‘tolerance’ around the specific Target value. We only want to highlight months where profit was Above or Below the permited tolerance. Click to …

#WOW2023 | Week 21 | Profit vs Target (with Tolerance) Read More

2023 Week 20: Can you build a heat map with bathymetry lines?

Introduction This week, I’m introducing the idea of taking bathymetry or contour lines on maps and placing the lines on heat maps. These lines come from identifying the elevation (for contour lines) or depth of water (for bathymetry lines) and creating a map using those values. Here is an example of a contour map from …

2023 Week 20: Can you build a heat map with bathymetry lines? Read More

#WOW2023 Week 19: Can you create a jitterfly chart? TC23 Live Edition

Introduction I’m so excited to bring this challenge to you live from Tableau Conference 2023 and I get to be the one who created the challenge. I saw something on twitter a while back and wanted to see if I could recreate it in Tableau. This challenge is not as easy as it looks but …

#WOW2023 Week 19: Can you create a jitterfly chart? TC23 Live Edition Read More

#WOW2023 Week 18: Can you combine relative and custom date filters?

Introduction One of my favorite challenges from the past is from Week 4 2020: Can you combine relative and custom dates? I was always fielding questions if I could have a relative date filter and a date picker on the same dashboard, but hadn’t ever figured it out. After Sean’s challenge that week, I implemented …

#WOW2023 Week 18: Can you combine relative and custom date filters? Read More

Scroll to Top