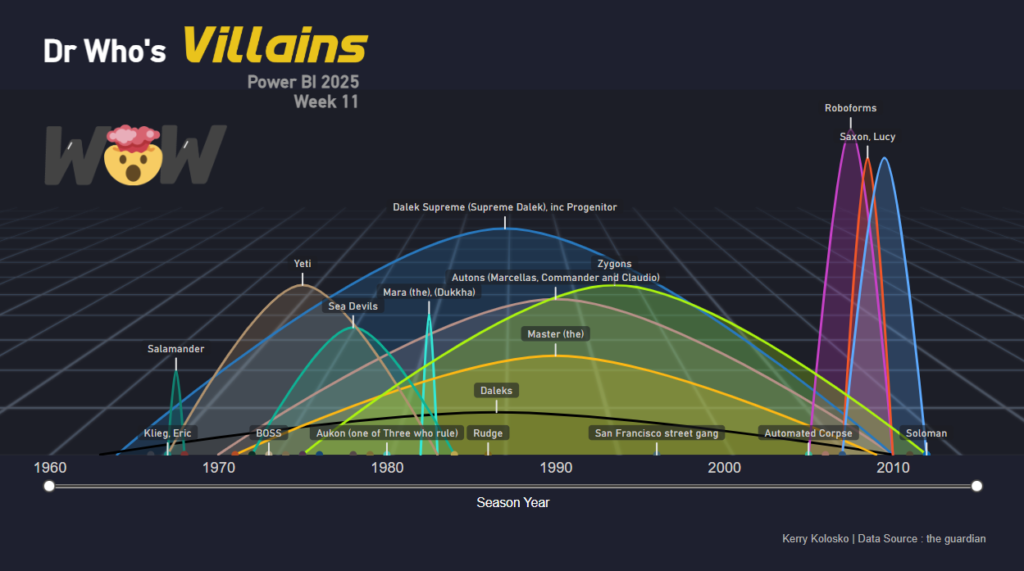
Workout Wednesday

2024 Week 37 | Sigma: What would you like help with?

Introduction This week’s challenge is a bit different; you have two options!  Imagine you’re creating a workbook showing off all the cool features and functionalities to your coworkers and want to provide a curated list of Sigma’s help documentation. In this challenge, you’ll create an embedded documentation element enabling the end users to choose a …

2024 Week 37 | Sigma: What would you like help with? Read More »

2024 Week 37 | Power BI: Create a Report with Light and Dark Mode

Introduction In honor of the Power BI Desktop dark mode being scheduled for public preview this month, we are making a report that allows you to switch between light mode and dark mode.  Requirements Get the data from Data.World.  Filter the report to the year 2024. Create a card that shows current year sales. Create …

2024 Week 37 | Power BI: Create a Report with Light and Dark Mode Read More »

#WOW2024 | 36 | Can you build a Measure Names Waterfall?

Introduction Welcome back to another challenge. This week we’re tackling some financial data and in particular, a waterfall chart based on multiple measure columns. Can you handle it? Click to open in Tableau Public Requirements Dashboard Size 800 x 600 One worksheet Create a waterfall chart for Gross Sales Discounts Net Sales COGS Profit Create …

#WOW2024 | 36 | Can you build a Measure Names Waterfall? Read More »

2024 Week 36 | Power BI: Recreate a NYT Interactive Article

Introduction Welcome back to Workout Wednesday. This week we’re taking inspiration from the incredible infographics team over at the New York Times. Their 2015 article looks at the average American’s contribution to the drought in California. As of today (Sep 2024), about a third of California remains abnormally dry. This challenge features some fun data work …

2024 Week 36 | Power BI: Recreate a NYT Interactive Article Read More »

2024 Week 35 | Sigma: Can you create a support request form?

Introduction Have I expressed my deep appreciation for Input Tables? With Snowflake or Databricks, we can write back to the database, which allows for some great methods of simplifying getting user-maintained information into a database. Even though I am a big fan of input tables, it’s still risky to allow users to edit a database …

2024 Week 35 | Sigma: Can you create a support request form? Read More »

2024 Week 35 | Power BI: Overlapping histogram with normal distribution curve

Introduction Overlapping histograms with normal curve overlays are used to compare the distribution of a numerical variable across different groups such as male and female body mass. With this we can glance the central tendency, spread, and skewness of the data within each group and also how well the data follows a normal distribution. The …

2024 Week 35 | Power BI: Overlapping histogram with normal distribution curve Read More »

2024 Week 34 | Power BI: Visual Calcs and Parameters

Introduction This week’s challenge is provided by guest contributor Erik Svensen https://www.linkedin.com/company/catmansolution. The workout will use visual calculations in combination with numeric parameters to highlight a period in a development chart. (Please note visual calculations do not currently publish to web) Requirements 1. Retrieve the data from Google Sheets – (you only need orders)2. Add …

2024 Week 34 | Power BI: Visual Calcs and Parameters Read More »