Year: 2024

2024 Week 39 | Sigma: Can you test out changes in cost?

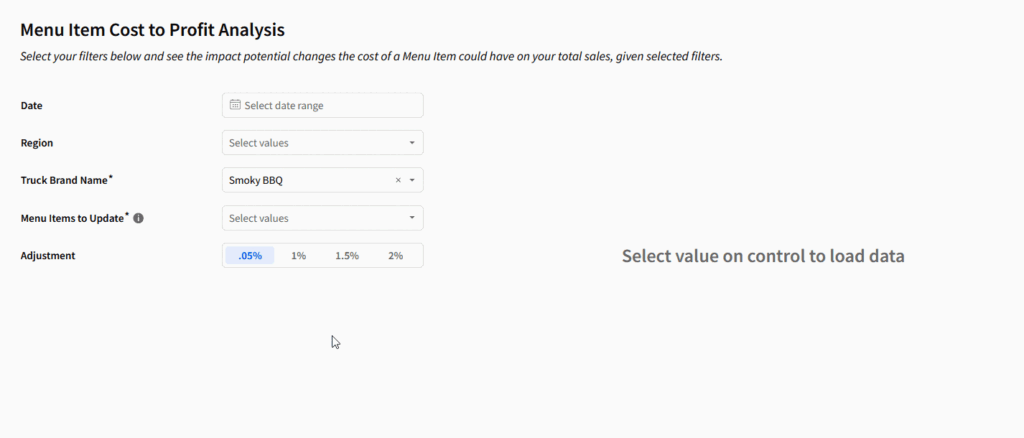
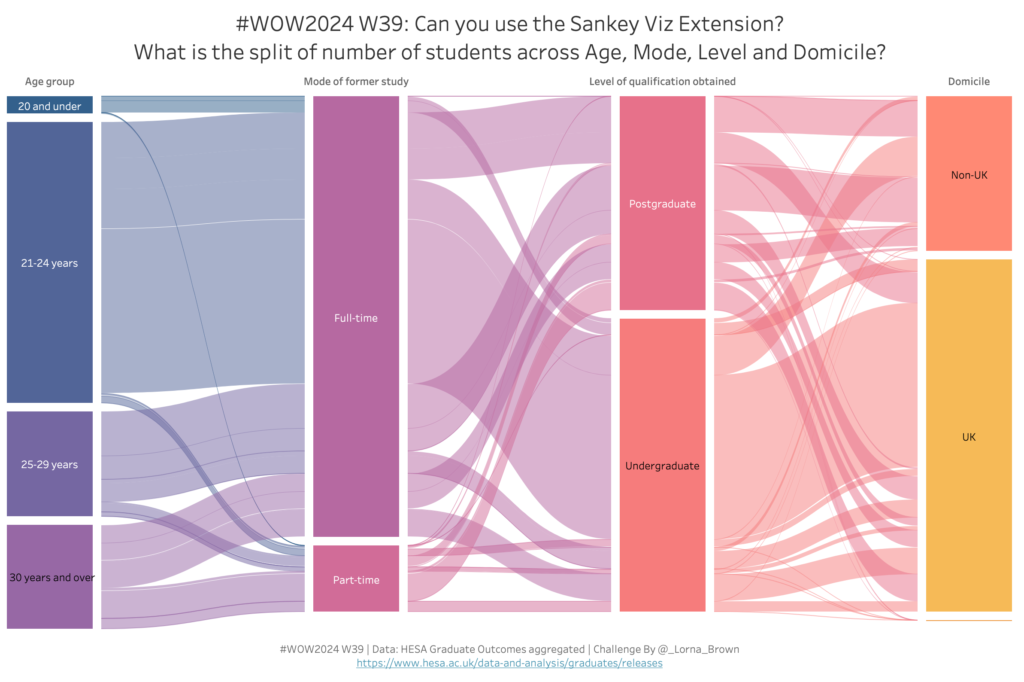
Introduction This week, I wanted to challenge myself to do something I didn’t know how to do in Sigma, I wanted to start laying the groundwork to do sensitivity analysis. I’ve often thought this would be possible in Sigma, since we can connect to Snowflake User-Defined Functions (UDFs) via Sigma’s function bar to call models …

2024 Week 39 | Sigma: Can you test out changes in cost? Read More

2024 Week 38 | Sigma: Can you create reference marks?

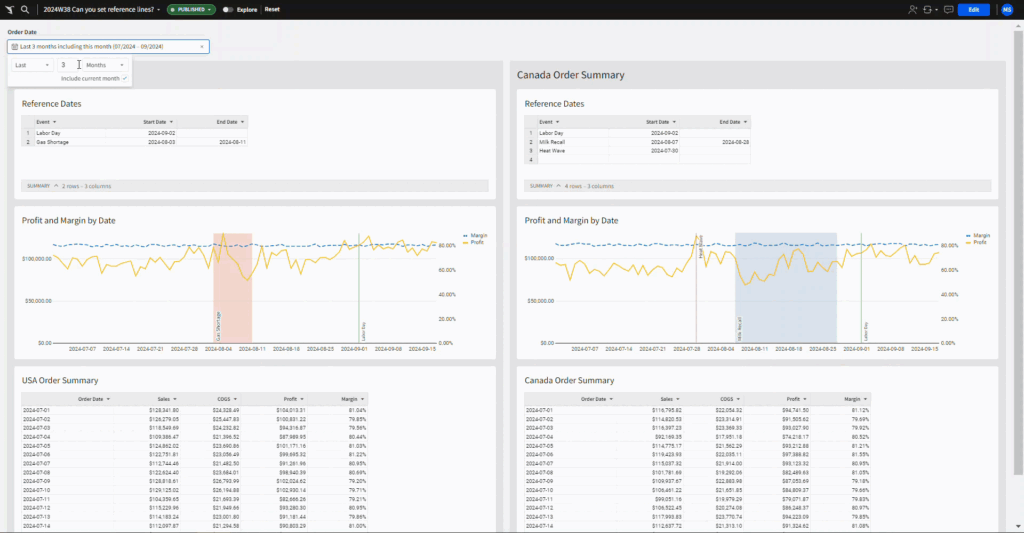
Introduction Welcome to Week 38! Sometimes there are events or notable data points that aren’t stored in your data, but you want to see how they effect the trends. Enter reference marks and conditional formatting! This week we practice using reference marks and conditional formatting to highlight specific dates and events. The formatting styles and …

2024 Week 38 | Sigma: Can you create reference marks? Read More

#WOW2024 | Week 38 | Can you create multi-select parameters?

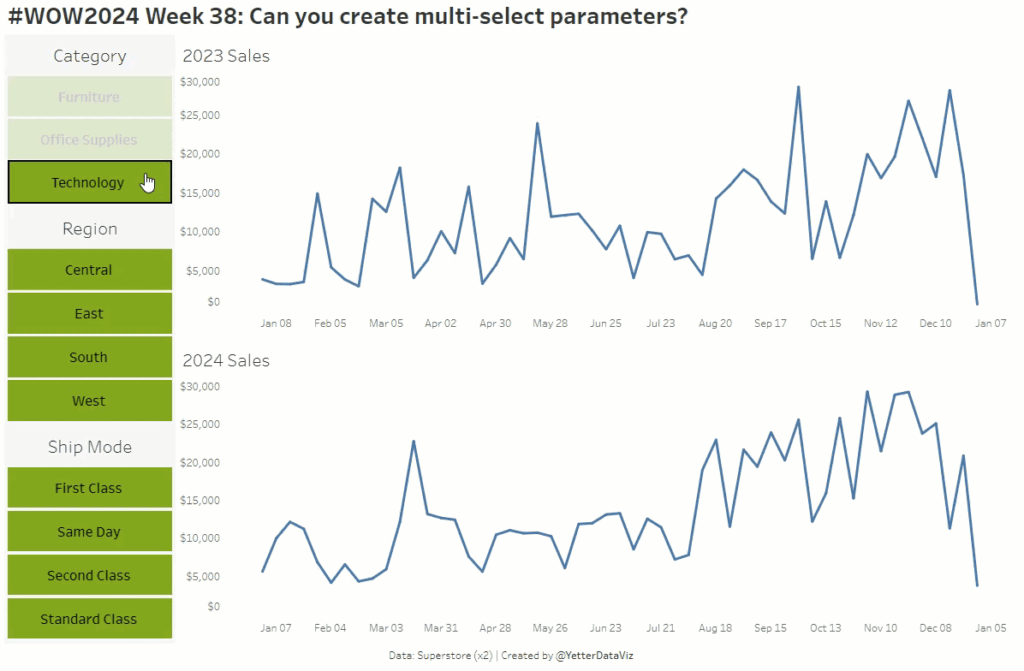
Introduction This week’s challenge again comes from trying to solve a problem in my day job, where I was exploring the possibility of parameters being multi-select like filters. We couldn’t use filters because we had different data sources, so I found a few forum and blog posts that make multi-select parameters a possibility, even if …

#WOW2024 | Week 38 | Can you create multi-select parameters? Read More

2024 Week 37 | Sigma: What would you like help with?

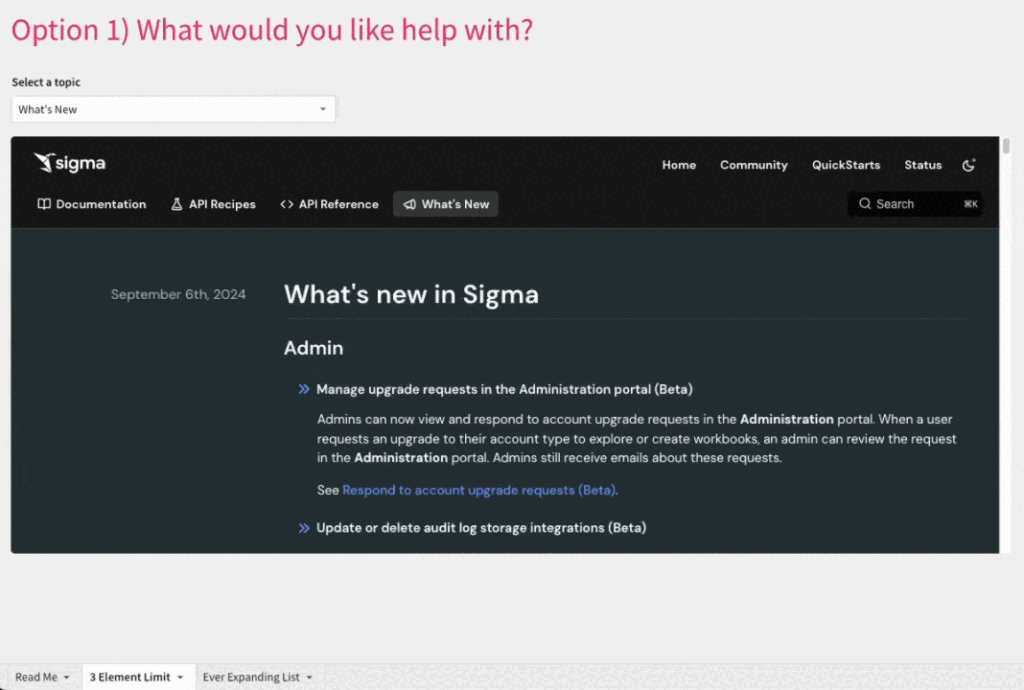
Introduction This week’s challenge is a bit different; you have two options!  Imagine you’re creating a workbook showing off all the cool features and functionalities to your coworkers and want to provide a curated list of Sigma’s help documentation. In this challenge, you’ll create an embedded documentation element enabling the end users to choose a …

2024 Week 37 | Sigma: What would you like help with? Read More

2024 Week 37 | Power BI: Create a Report with Light and Dark Mode

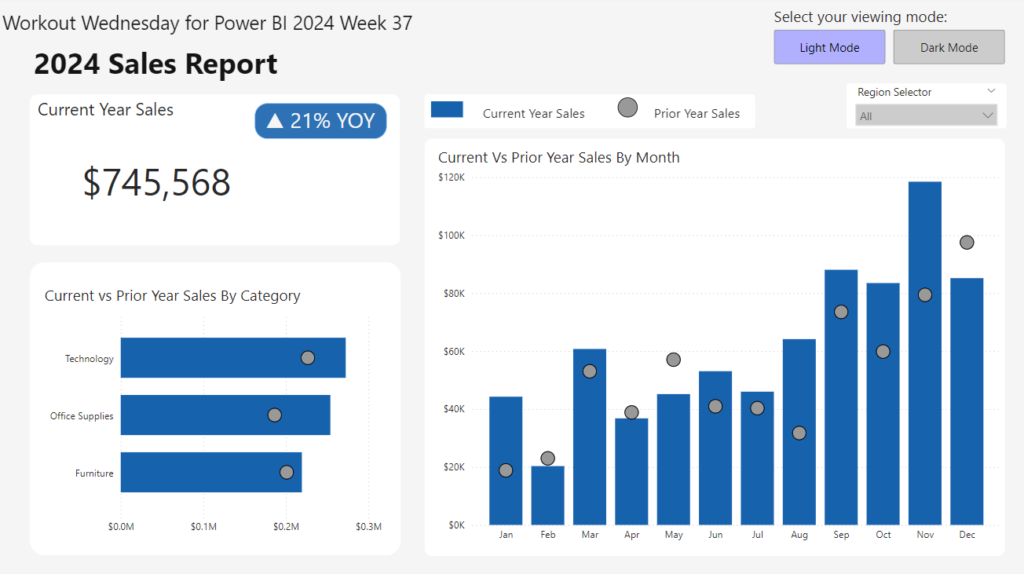
Introduction In honor of the Power BI Desktop dark mode being scheduled for public preview this month, we are making a report that allows you to switch between light mode and dark mode.  Requirements Get the data from Data.World.  Filter the report to the year 2024. Create a card that shows current year sales. Create …

2024 Week 37 | Power BI: Create a Report with Light and Dark Mode Read More

#WOW2024 | WEEK 37 | What medals did each country win each day?

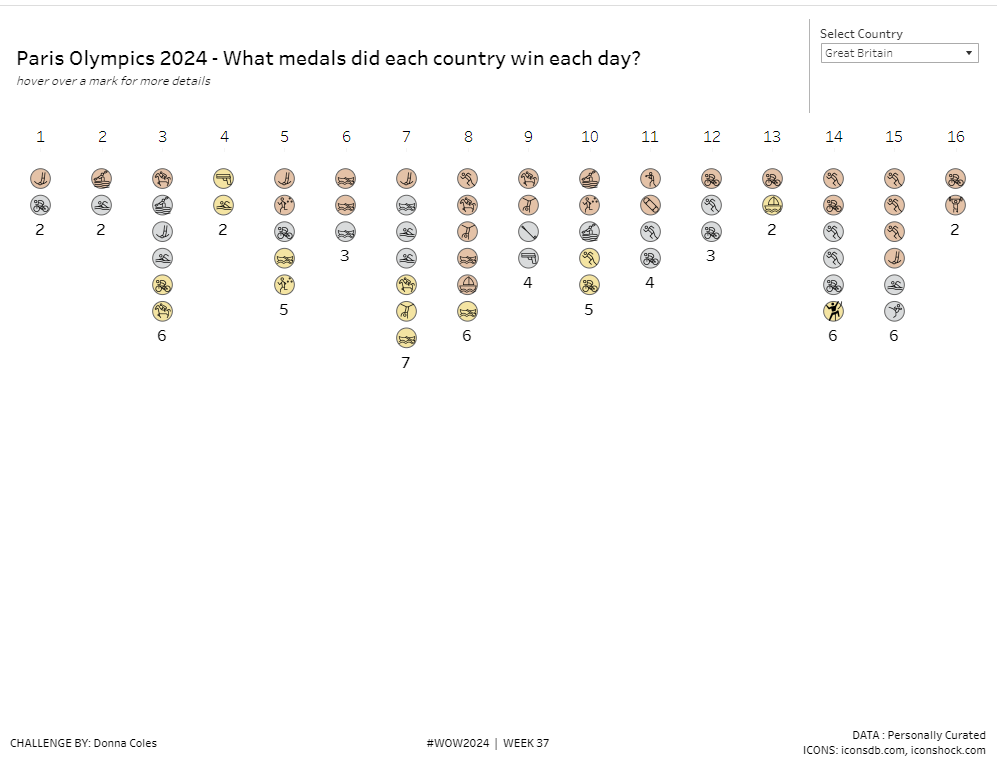
Introduction We’re going back to the Paris 2024 Olympic Games this week. I loved them and built my own version of the medal table that I’d been looking at constantly throughout the 2 weeks based off of the BBC (UK) mobile app. I added the ability to click and see what medals were won each …

#WOW2024 | WEEK 37 | What medals did each country win each day? Read More

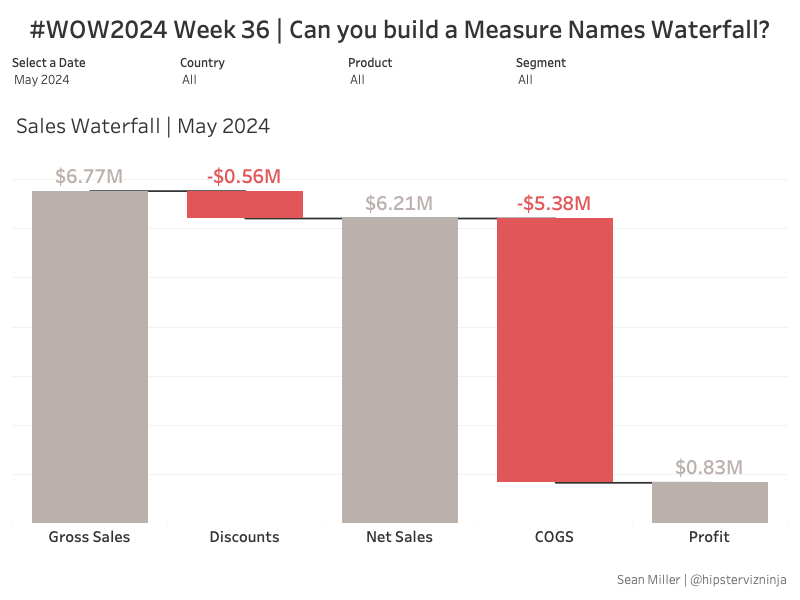
#WOW2024 | 36 | Can you build a Measure Names Waterfall?

Introduction Welcome back to another challenge. This week we’re tackling some financial data and in particular, a waterfall chart based on multiple measure columns. Can you handle it? Click to open in Tableau Public Requirements Dashboard Size 800 x 600 One worksheet Create a waterfall chart for Gross Sales Discounts Net Sales COGS Profit Create …

#WOW2024 | 36 | Can you build a Measure Names Waterfall? Read More

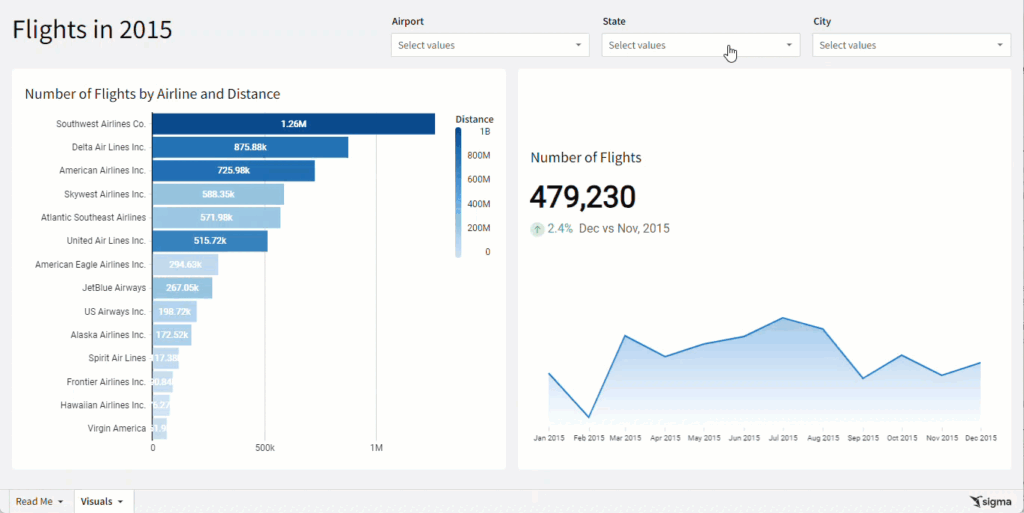
2024 Week 36 | Sigma: Can you filter without targets?

Introduction Welcome to Week Thirty-Six! This week, we’re going to focus on some more advanced filtering.  By now, you should know how to utilize a page control’s targets to filter a single column in an element.  What do you do when you need to affect multiple columns in the same element?  You can utilize a …

2024 Week 36 | Sigma: Can you filter without targets? Read More

Scroll to Top