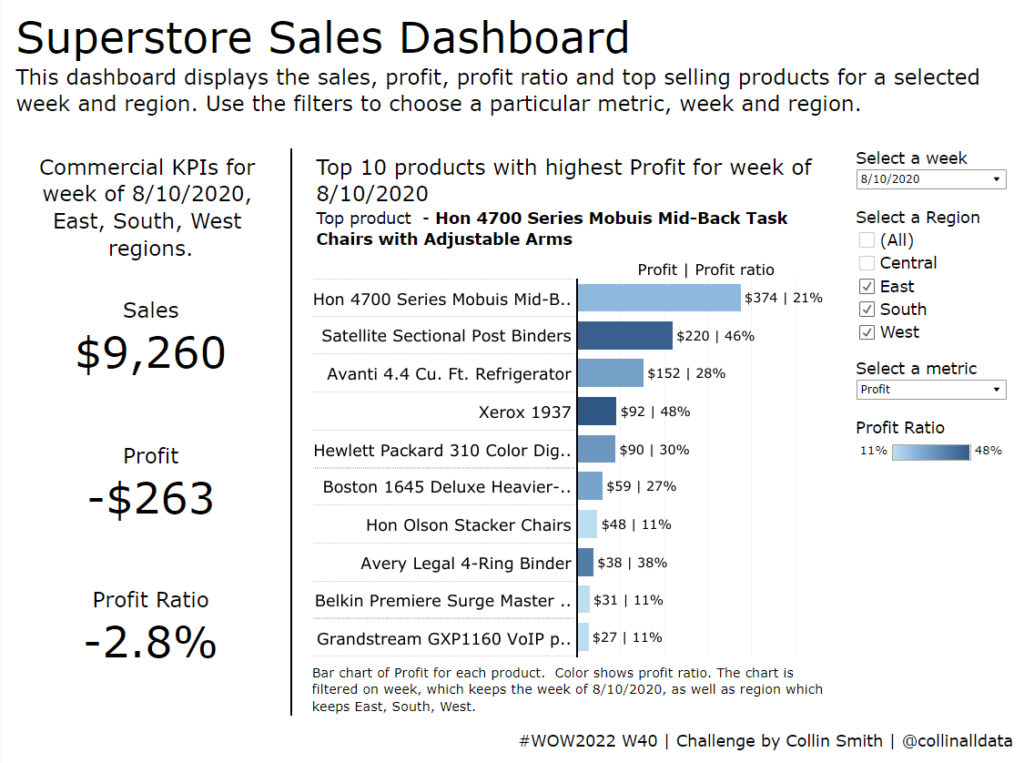
#WOW2022 W33: Can you compare the latest month to the prior X months average?

Introduction When looking through the challenge insights I realised we haven’t had many of the fundamental LOD style Workouts for a while. So this week we take a look at how does the latest month compare to the prior X months average? Click to open in Tableau Public Requirements Dashboard Size: 800 x 700px 2 …

#WOW2022 W33: Can you compare the latest month to the prior X months average? Read More »

2022 Week 32 | Leverage Field Parameters in Measures

Introduction My name is Spencer Hamilton, Analytics Consultant with phData, and I’ll be guest hosting this week’s challenge! For the challenge, we’re going to look at one of Power BI’s newer features, Field Parameters, and create some calculations that dynamically change based on the selected parameter value. In this specific example we’re looking at Sample …

2022 Week 32 | Leverage Field Parameters in Measures Read More »

2022 Week 31 | Power BI: Connected Scatter with PlotlyJS

Introduction This week for Workout Wednesday we are getting familiar with the PlotlyJS visual by creating traces and annotations for a connected scatterplot.   Connected scatterplots are a cross between a scatterplot and a lineplot whereby two numeric variables are connected by a third ordered variable (often time).   The below graph created with the …

2022 Week 31 | Power BI: Connected Scatter with PlotlyJS Read More »

2022 – Week 29: What is the Time-Weighted Return?

Introduction Working with financial data is hard. There are some calculations that make for long evenings to get right. One of those calculations is Time-Weighted Return. This challenge is simple: calculate the Time-Weighted Return Rate for a simple data source and return a line chart. Click to open in Tableau Public Requirements Dashboard Size: 400px …

2022 – Week 29: What is the Time-Weighted Return? Read More »