#WOW2024 | Week 21 | Can you rebuild this tube map?
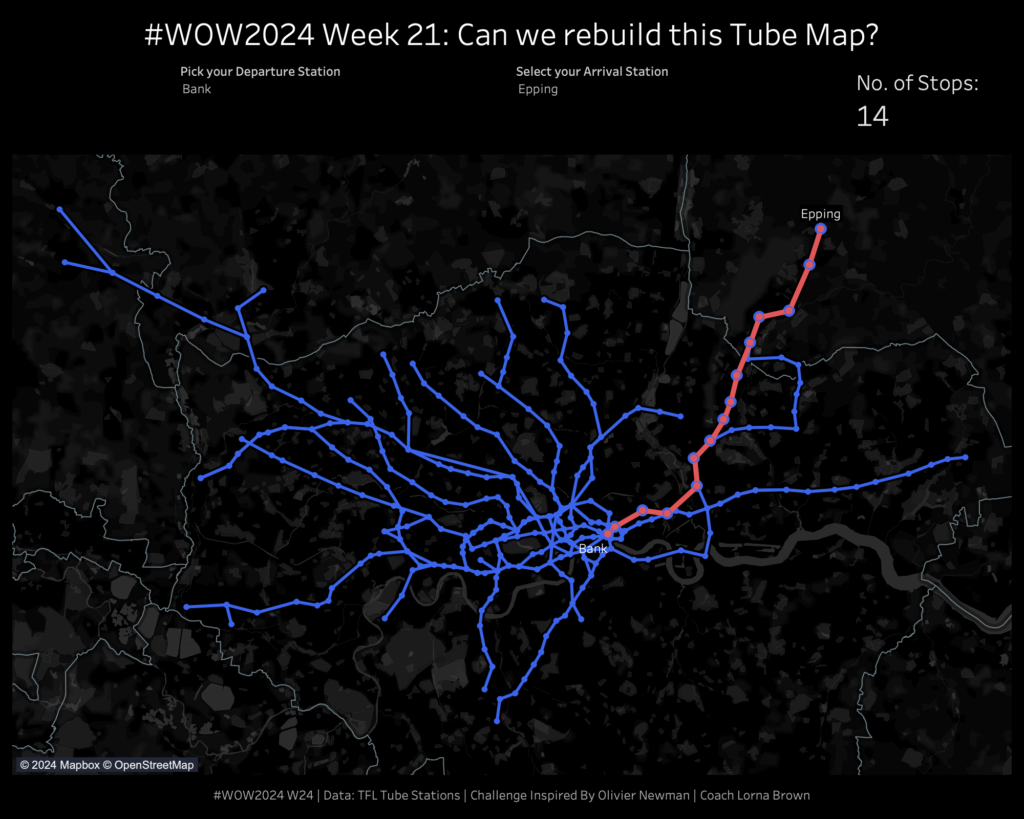
Introduction This week I wanted to do something spatial related, so I challenged Olivier Newman, one of our Data School Consultants, to build me a challenge. I am breaking his challenge into two weeks. The first being this one. Can you rebuild this tube map? Ideally you will need 1 parameter and 1 set and …
#WOW2024 | Week 21 | Can you rebuild this tube map? Read More »