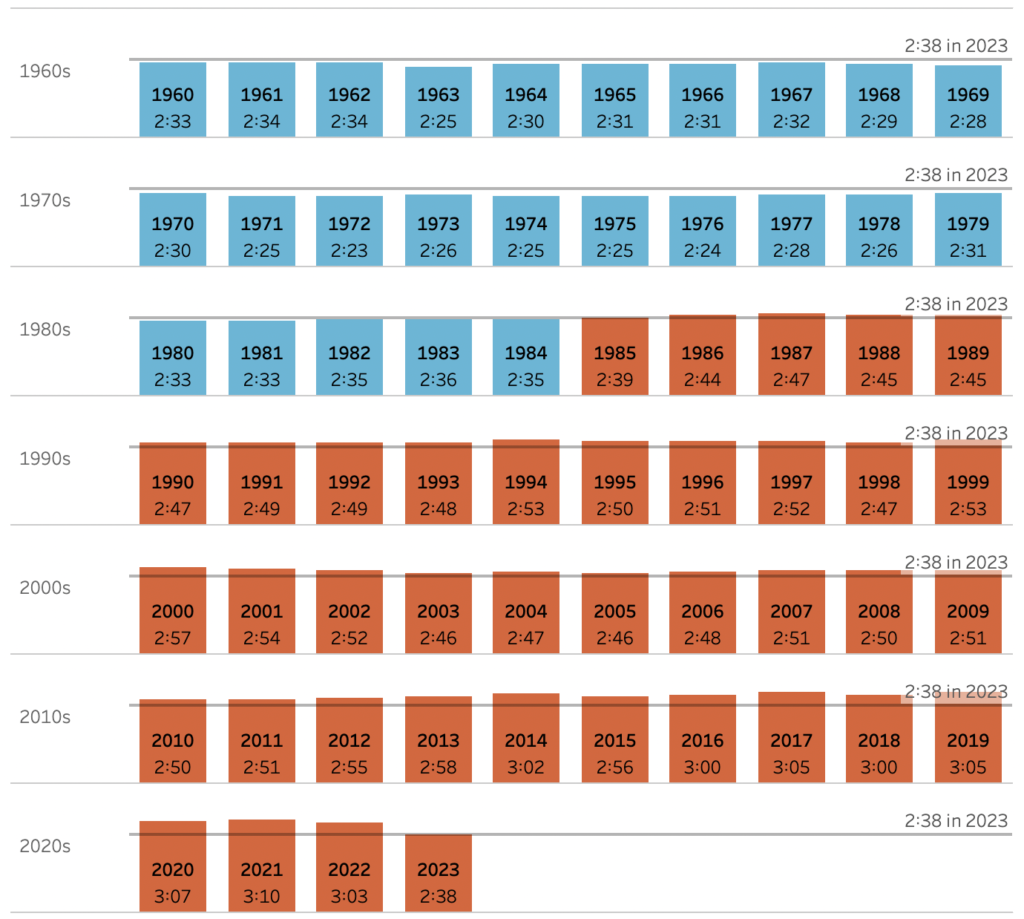
Workout Wednesday

2023 Week 08 | Power BI: Create an interactive resume

Introduction Welcome back to Workout Wednesday! This week we will use Power BI to build an interactive resume. This challenge is for a few different audiences. 1) Job seekers – feel free to use this template, plug in your information, make design tweaks, and post this to your portfolio! 2) Data vizzers – use the starter …

2023 Week 08 | Power BI: Create an interactive resume Read More »

2023 Week 8: Can you build a comet chart as an alternative to a side-by-side bar chart?

Introduction The theme for February 2023 has been alternatives. This week I present an alternative (and trust me, there are many other alternatives) to my least favorite chart: the side-by-side bar chart. The reason this chart is so difficult for me is because it takes up a lot of space and when I am doing …

2023 Week 8: Can you build a comet chart as an alternative to a side-by-side bar chart? Read More »

2023 Week 07 | Power BI: Non-linear Regression

Introduction This week for Workout Wednesday we will be trying our hand at non-linear regression with the Deneb custom visual. With Vega and Vega-Lite we can create a non-linear line of best fit over our data points and utilise the statistical API to return a correlation coefficient. Requirements Power Query Obtain the dataset from the …

2023 Week 07 | Power BI: Non-linear Regression Read More »

#WOW2023 | Week 6 | Can you create a normalized jitterplot?

Introduction As Donna mentioned last week, this month we’re focusing on alternative chart types. This jitterplot is a fun one inspired by one of Steve Wexler‘s charts in The Big Book of Dashboards. I like jitterplots because they allow you to easily see how an individual compares to the rest of the group via distribution, …

#WOW2023 | Week 6 | Can you create a normalized jitterplot? Read More »

#WOW2023 | Week 5 | Can you build a funnel chart?

Introduction Hi everybody. It’s now my turn to set my first challenge as part of the official #WOW crew – eeek!. For those of you who don’t know me, I’ve been completing these challenges since the program was launched in 2017, and I blog solution guides on my personal blog at https://donnacoles.home.blog/. I’ve been approached …

#WOW2023 | Week 5 | Can you build a funnel chart? Read More »

Vertical Area Chart describing Republican and Democrat shifts in ideology

2023 Week 03 | Power BI: Vertical Area Chart

Introduction Howdy All! We’re all topsy-turvey this week turning line charts on their side! ⇩ This weeks challenge was inspired by Nick Desbarats article Are Vertical Line Charts Ever a Good Idea? Can you find some other examples where vertical line charts may be a good idea? ⋟^◕ܫ◕^⋞ Happy Vizzing Requirements Power Query Obtain the voteview_polarization_data.csv …

2023 Week 03 | Power BI: Vertical Area Chart Read More »