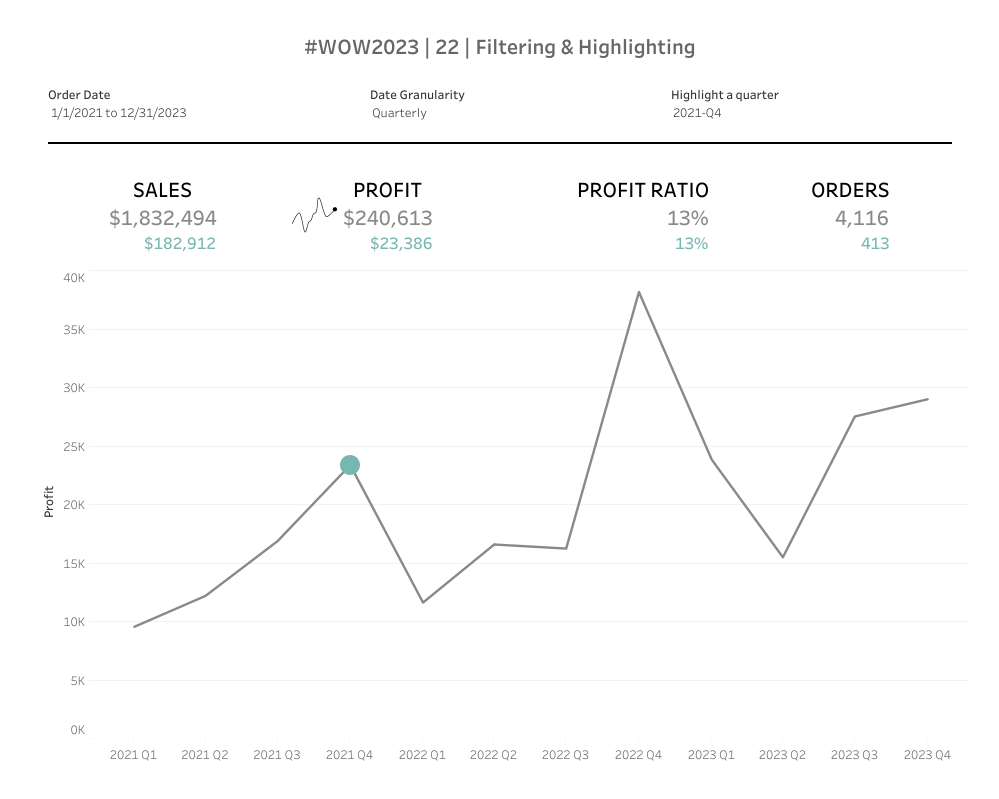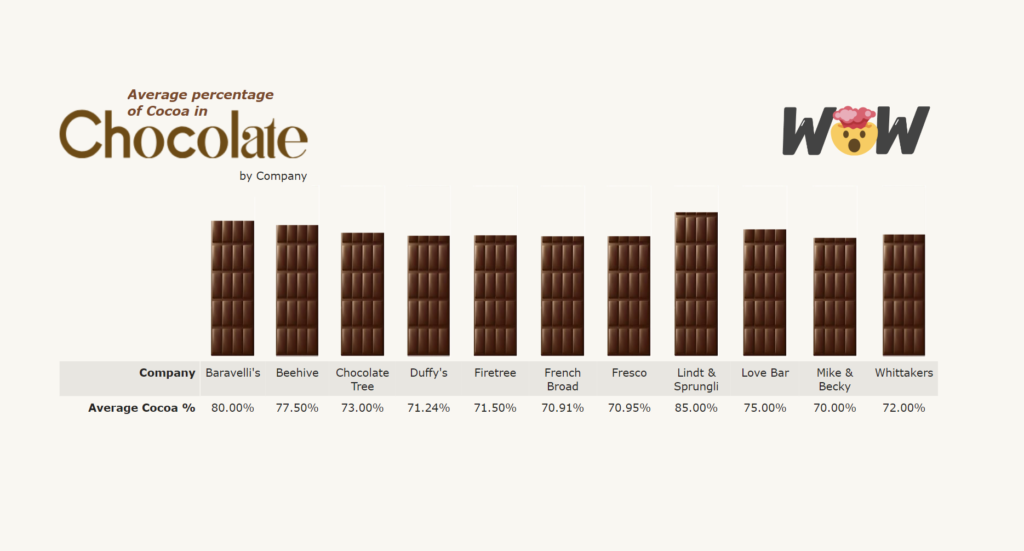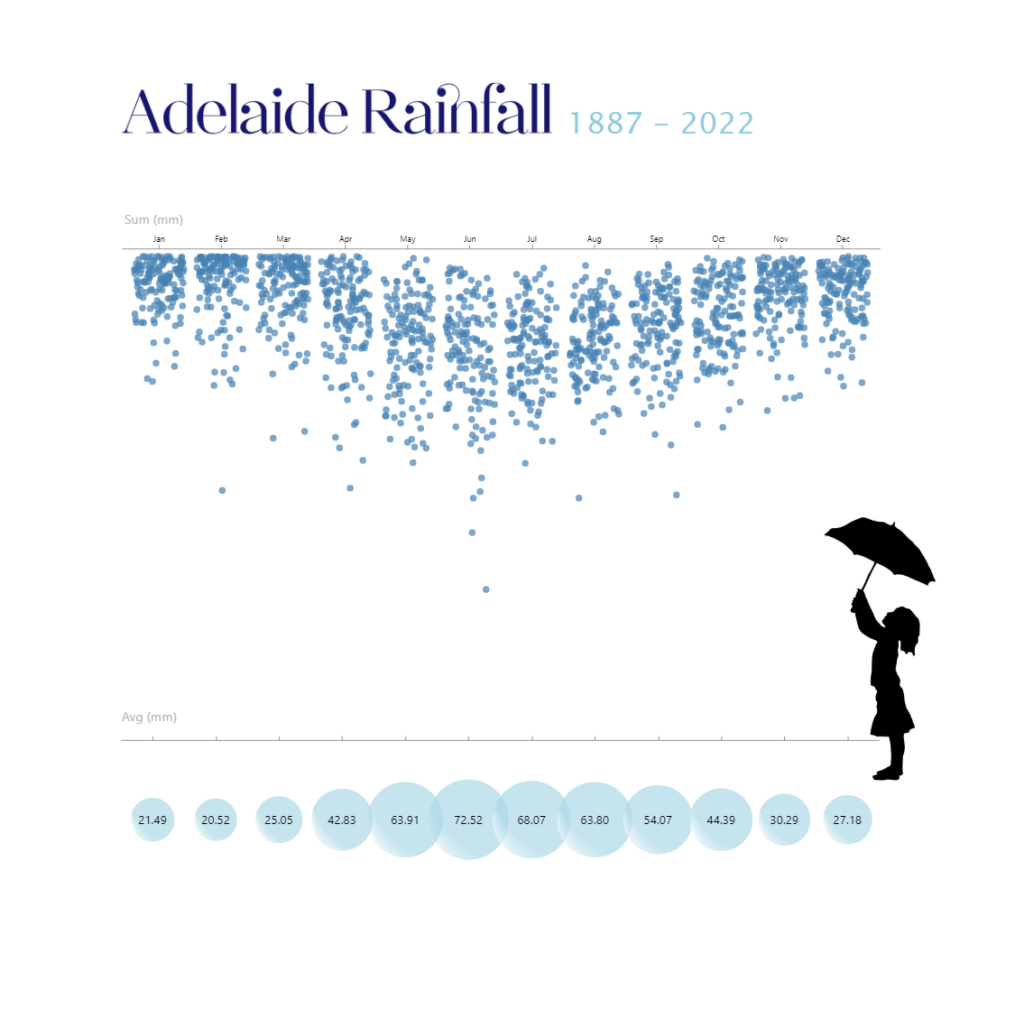
2023 Week 22 | Power BI: Inverted Jittered Scatter
Introduction This week’s challenge uses Deneb custom visual to create a jittered scatter with inverted axis plus a bubble plot with labels. Requirements Power Query Obtain the dataset from Australian Bureau of Meteorology Website Model and load data Power BI Desktop Option 1: Obtain Deneb Custom Visual from AppSource Create a Scatter Chart with point …
2023 Week 22 | Power BI: Inverted Jittered Scatter Read More