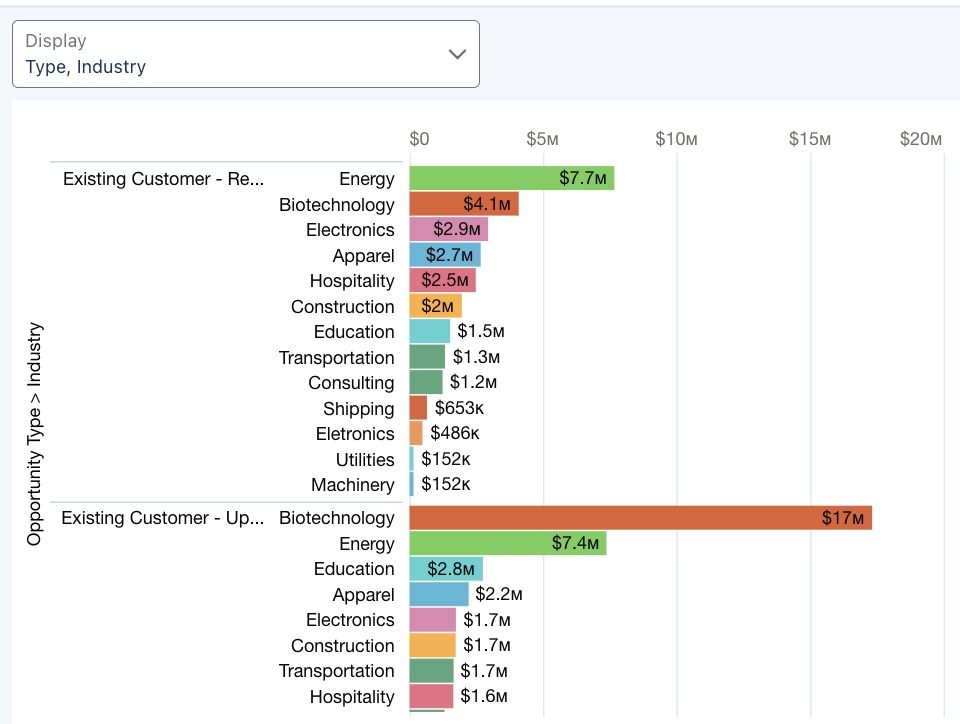
2024 Week 8 | Power BI: Build a Pipeline Funnel with Core Visuals
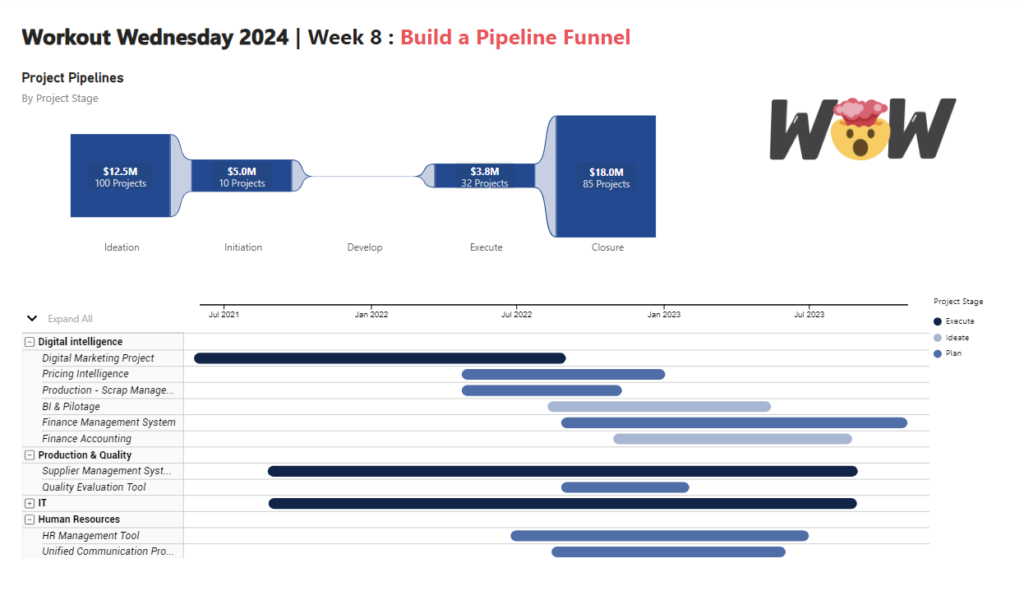
Introduction This week’s challenge we will be utilising visual calculations (this will require turning Visual Calculations on in Preview settings of February 2024 Desktop) and some additional new data label formatting options to create a pipeline funnel with out of the box visuals in Power BI. Visual calculations can be handy for visual specifiic calculations …
2024 Week 8 | Power BI: Build a Pipeline Funnel with Core Visuals Read More