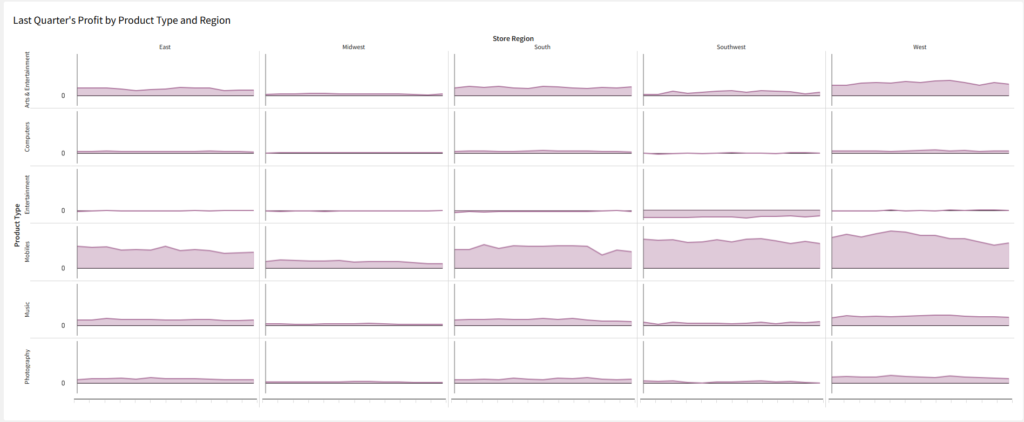
Year: 2024

#WOW2024 | Week 16 | Can you create a sales dashboard by effectively utilizing headers?

Introduction This week’s challenge comes from Chasoso (Hideaki Yamamoto), who is an active participant in WorkoutWednesday and was the runner-up in last year’s Viz contest at the Japan Tableau User Group (JTUG) annual meeting. # Introduction(EN)I’m very happy to join Workout Wednesday as a guest coach.Because I’ve been encountering interesting vizzes every week, I admire …

#WOW2024 | Week 16 | Can you create a sales dashboard by effectively utilizing headers? Read More

2024 Week 15 | Power BI: Visualize sunrise times with a line chart

Introduction Since I watched the solar eclipse from Texas this week, we have a solar theme. We are visualizing the sunrise time each day in 2024 to date. I’m keeping it simple with the line chart core visual, but you can use whatever visual you would like.  Requirements 1. Retrieve the data from Data.World.  2. …

2024 Week 15 | Power BI: Visualize sunrise times with a line chart Read More

#WOW2024 Week 15: Can you create a (super) dynamic trellis chart?

Introduction Continuing with our community month, I decided to invite the OG himself back for a challenge, Andy Kriebel. All I’m going to say about this challenge is, I’m sorry if it’s super hard and don’t be afraid to sneak a peak into the actual workbook to get insight into how Andy’s mind works! Click …

#WOW2024 Week 15: Can you create a (super) dynamic trellis chart? Read More

2024 Week 15 | Sigma: Can you identify the top, average, and bottom profitable customers? 

Introduction This week, we’re building a staple in my bar chart library: Top, Bottom, and Other Values. I often use this bar chart to easily show the breadth of the outliers while not losing sight of the typical. This challenge is also a great example of the flexibility of modeling at different levels of granularity …

2024 Week 15 | Sigma: Can you identify the top, average, and bottom profitable customers?  Read More

2024 Week 14 | Power BI: Use a matrix to re-create a Tableau viz

Introduction Welcome back to Workout Wednesday! This week we’re recreating a really neat viz that was originally created by Flávio Matos for the Tableau team back in 2023. Flavio created the Periodic Table of Wine, with an option for users to select the food they’ll be eating to help them pair the perfect wine. Today, …

2024 Week 14 | Power BI: Use a matrix to re-create a Tableau viz Read More

2024 Week 14 | Sigma: It’s a Bird… It’s a Plane… It’s Lookup Functions!

Introduction Welcome to Week Fourteen! This week, you’re going to learn about Sigma’s Lookup function.  Lookups are very useful for joining information from one data source to another, without accidentally fanning your data.  Sigma also has a Lookup Wizard for a foolproof way of utilizing this function. When I book a flight, I am particularly concerned …

2024 Week 14 | Sigma: It’s a Bird… It’s a Plane… It’s Lookup Functions! Read More

#WOW2024 | Week 14 | Can you build a Trellis of Profit Ratio Gauges?

Introduction This week kicks off our Community Month, where we invite folks from the Tableau community to create a challenge. First up is Jack Hineman, frequent WOW participant and Tableau Social Ambassador: I am so excited to be participating in Community Month for #WorkoutWednesday. I have been a weekly participant in #WOW challenges for the …

#WOW2024 | Week 14 | Can you build a Trellis of Profit Ratio Gauges? Read More

Scroll to Top