#WOW2024 | Week 13 | Can you build this segmented bar chart?

Introduction I’m always on the lookout for inspiration to share in a #WorkoutWednesday challenge, and Sam Parson’s recent movie viz provided that for this week. Sam displayed the total revenue for the top 50 movie franchises, directly alongside a stacked bar depicting the revenue for each individual movie in that franchise. There is also a …

#WOW2024 | Week 13 | Can you build this segmented bar chart? Read More »

Overlapping Histogram

2024 Week 13 | Power BI: Overlapping Histogram

Introduction In this week’s challenge we are creating an Overlay Histogram. An overlay histogram utilises overlapping columns or bars to compare two populations. In this case, we are utilising the speed dating data from a previous challenge to compare male and female differences in dating preferences. Requirements Obtain the data from the Workout Wednesday 2022 …

2024 Week 13 | Power BI: Overlapping Histogram Read More »

2024 Week 12 | CRM Analytics: Brazil’s opportunities dashboard 

Introduction Maps, maps, and maps. We all love them, after all, in an era where data drives decision-making across industries, the significance of map charts cannot be overstated. From tracking global trends to uncovering localized patterns, these visualizations serve as powerful navigational aids in our quest for understanding. Following our trend of past challenges, this …

2024 Week 12 | CRM Analytics: Brazil’s opportunities dashboard  Read More »

2024 Week 12 | Sigma: Can you take Action?

Introduction For this week’s challenge, we’re exploring Sigma’s workbook actions, a powerful feature that enables better end-user experiences, nuanced data exploration, and more impactful presentations. Sigma’s workbook actions cover a wide range of interactions, but for this first challenge, we’ll focus on two common action scenarios: clicking to filter and clicking to change.  As you …

2024 Week 12 | Sigma: Can you take Action? Read More »

2024 Week 12 | Power BI: Contact Cards and Headerless Tables

Introduction This week’s challenge uses a custom visual to achieve some formatting that cannot currently (as of March 2024) be achieved using core visuals. First, we have a table that contains 2 columns and no headers. Next, we have some contact cards that contain both an image and text. The catch is that the number …

2024 Week 12 | Power BI: Contact Cards and Headerless Tables Read More »

2024 Week 11 | Power BI: IBCS Charts with Injae

Introduction Welcome back to Workout Wednesday! This week we’re taking notes out of Injae Park’s portfolio and recreating one of his IBCS charts. IBCS, or the International Business Communication Standards is a set of rules to level up how businesses talk and share info. Think of it as a cheat code for clearer charts and …

2024 Week 11 | Power BI: IBCS Charts with Injae Read More »

2024 Week 11 | Sigma: Can you find the Subtotal?

Introduction Welcome to Week Eleven! This week, you’re going to learn about Sigma’s Subtotal, PercentOfTotal, and GrandTotal functions.  I find these functions particularly useful in adding context to ToolTips or Pivot tables. In this challenge, you will explore the various types of subtotaling functions.  As you work through this challenge, think about the story the different …

2024 Week 11 | Sigma: Can you find the Subtotal? Read More »

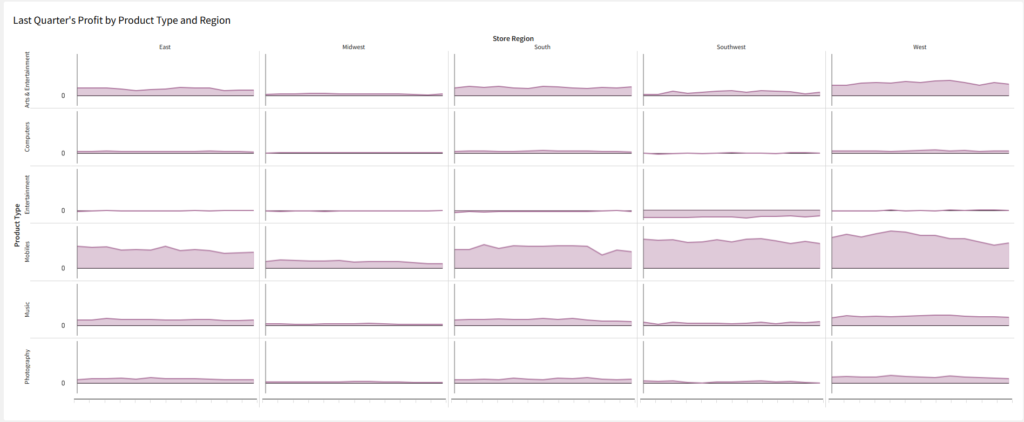
#WOW2024 | Week 11 | Can you filter a Small Multiples chart?

Introduction I may have gotten a little overexcited with this challenge by combining TWO problems that some of my colleagues came up against recently when trying to solve problems for their clients. That being said, this week’s challenge should be a good workout. Since the challenge applies some more advanced calculations, I have broken down …

#WOW2024 | Week 11 | Can you filter a Small Multiples chart? Read More »